BNB is setting its sights on new year-to-date highs, fueled by increased DApp activity on the BNB Chain and the introduction of a fresh Binance incentive program.
The native token of BNB Chain, BNB, initiated a rebound on January 26, gaining 3% and reclaiming the $300 mark. Despite its previous weakness, the ongoing recovery is underpinned by a surge in network activity.
Binance’s recent launch of a “dual investment” product is poised to contribute to BNB’s trading volumes, which have surpassed $998 million in the last 24 hours.
To gauge the health of a blockchain ecosystem, a comparison with competing chains is essential. While Ethereum dominates DApp volumes, amassing over $31.73 billion in the past week, with an NFT volume of $226 million, BNB Chain recorded $3.82 billion in DApp volumes. Notably, its NFT volume surged by 11% during the same period, reaching $864.93 million. BNB Chain leads in active unique addresses (UAW), boasting 2 million UAWs compared to Ethereum’s 359,380.
In a relative context, BNB Chain witnessed a 6.4% growth in the number of addresses engaging with DApps over seven days. This, combined with a rising transaction volume, contributes to the growing total value locked (TVL).
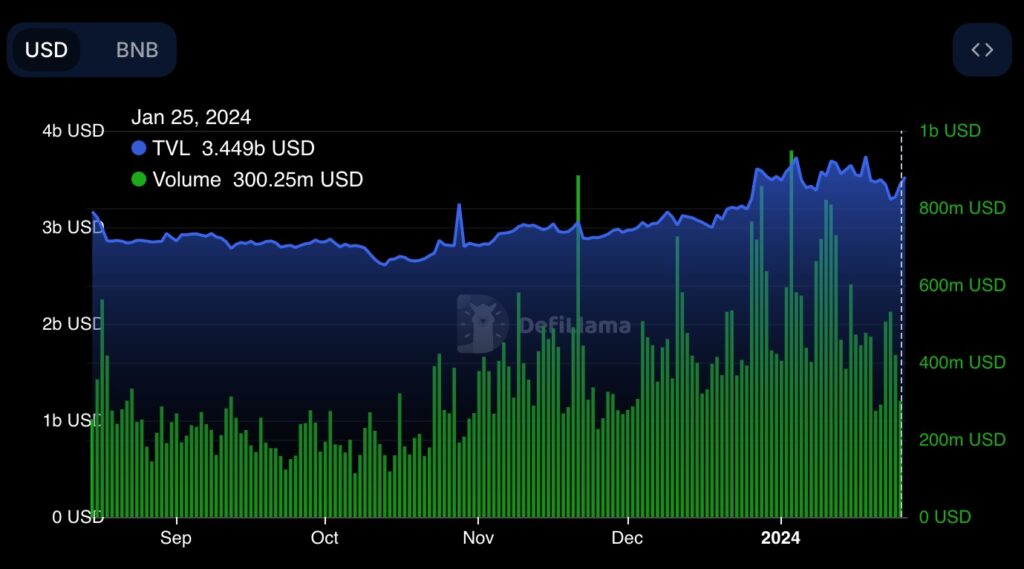
Data from DefiLlama reveals a steady increase in BNB Chain’s TVL from mid-December 2023, peaking at $3.73 billion on January 18. Despite a slight dip in this metric in recent days, a resurgence on January 25 indicates growing user trust in the blockchain.
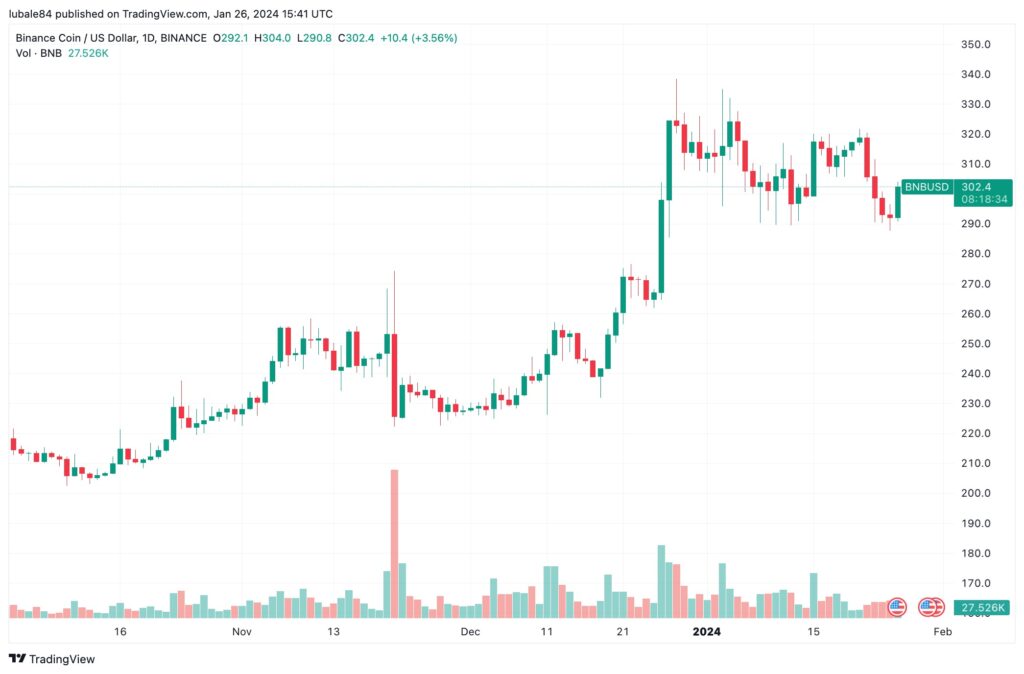
Analyzing the chart, BNB’s bull flag is indicative of potential upward movements. Although the price retraced from the eight-month high of $340 on December 28, 2023, the presence of a bull flag on the daily chart suggests a continuation of the uptrend.
Facing resistance at the flag’s upper boundary of $316, a daily candlestick close above this level could signal a breakout, projecting a potential uptick to $450—a 48% increase from the current price.
Positive indicators, including the upward trajectory of the 50-day EMA, 100-day EMA, 200-day EMA, and the RSI, suggest favorable market conditions for potential upside. The rise in price strength from 40 to 50 indicates bullish activity during market dips.
On the downside, bears might attempt to lower the price, with the flag’s lower limit at $282 acting as the initial defense. Additional support levels may come into play at the 100-day EMA ($271) and the major support level at $250.